Quick Start#
Description#
MATTE (Module Alignment of TranscripTomE) is a python package aiming to analysis transcriptome from samples with different phenotypes in a module view. Differiential expression (DE) is commonly used in analysing transcriptome data. But genes are not work alone, they collaborate. Network and module based differential methods are developed in recent years to obtain more information. New problems appears that how to make sure module or network structure is preserved in all of the phenotypes. To that end, we proposed MATTE to find the conserved module and diverged module by treating genes from different phenotypes as individual ones. By doing so, meaningful markers and modules can be found to better understand what’s really difference between phenotypes.
Advantages
In the first place, MATTE merges the data from phenotypes, seeing genes from different phenotypes as new analyzing unite. By doing so, benefits got as follows:
MATTE considering the information in phenotypes in the preprocessing stage, hoping to find more interesting conclusion.
MATTE is actually making transcriptome analysis includes the relationship between phenotypes, which is of significance in cancer or other complex phenotypes.
MATTE can deal with more noise thanks to calculation of relative different expression (RDE) and ignore some of batch effect.
In a module view, “Markers” can be easily transfer to other case but not over fits compare to in a gene view.
The result of MATTE can be easily analysed.
Install#
Install from pip is recommended.
pip install MATTE
Genes’ Clustering#
Preprocess
CLustering
Analysis
Pipeline#
import MATTE
print(MATTE.__version__)
## init with default settings
pipeline = MATTE.AlignPipe(stats_type='mean', target='cluster', preprocess=True)
## Showing the Pipe composition
pipeline
1.2.1
MATTE calculation pipeline
## STEP 0   <PipeFunc> inputs_check()
## STEP 1   <PipeFunc> RPKM2TPM()
## STEP 2   <PipeFunc> log2transform()
## STEP 3   <PipeFunc> expr_filter(gene_filter=None)
## STEP 4   <PipeFunc> LocKernel_Transform(kernel_type='mean',centering_kernel=True,outer_subtract_absolute=True,double_centering=True)
## STEP 5   PCA(n_components=16)
## CLUSTER STEP 0   <PipeFunc> CrossCluster(preset='kmeans',n_clusters=8,method='a',dist_type='a',n_iters=20)
## CLUSTER STEP 1   <PipeFunc> build_results()
## In MATTEPipe stores some functions (PipeFunc type)
pipeline.funcs,pipeline.cluster_func
([<PipeFunc> inputs_check(),
  <PipeFunc> RPKM2TPM(),
  <PipeFunc> log2transform(),
  <PipeFunc> expr_filter(gene_filter=None),
  <PipeFunc> LocKernel_Transform(kernel_type='mean',centering_kernel=True,outer_subtract_absolute=True,double_centering=True),
  PCA(n_components=16)],
 [<PipeFunc> CrossCluster(preset='kmeans',n_clusters=8,method='a',dist_type='a',n_iters=20),
  <PipeFunc> build_results()])
## Running the test.(data is generated randomly)
R,data = MATTE.package_test(n_genes=1000,pipe=pipeline,verbose=False)
# basic usage
R = pipeline.calculate(df_exp=data['df_exp'],df_pheno=data['df_pheno'])
Mon May 30 15:25:52 2022     Running function <PipeFunc> inputs_check()
Mon May 30 15:25:52 2022     Running function <PipeFunc> RPKM2TPM()
Mon May 30 15:25:52 2022     Running function <PipeFunc> log2transform()
Mon May 30 15:25:52 2022     Running function <PipeFunc> expr_filter(gene_filter=None)
Mon May 30 15:25:52 2022     Running function <PipeFunc> LocKernel_Transform(kernel_type='mean',centering_kernel=True,outer_subtract_absolute=True,double_centering=True)
Mon May 30 15:25:52 2022     Calculating the kernel matrix using mean
Mon May 30 15:25:53 2022     Tranforming using model PCA(n_components=16)
Mon May 30 15:25:58 2022     Running function <PipeFunc> CrossCluster(preset='kmeans',n_clusters=8,method='a',dist_type='a',n_iters=20)
Mon May 30 15:25:58 2022     Running function <PipeFunc> build_results()
Mon May 30 15:25:58 2022     building cluster results
Inputs#
## Standard inputs
data['df_exp']
| sample0 | sample3 | sample4 | sample5 | sample8 | sample10 | sample13 | sample14 | sample16 | sample19 | ... | sample86 | sample87 | sample88 | sample90 | sample92 | sample93 | sample95 | sample96 | sample98 | sample99 | |
|---|---|---|---|---|---|---|---|---|---|---|---|---|---|---|---|---|---|---|---|---|---|
| gene0 | 2068.782009 | 2074.743627 | 2358.613186 | 2214.779271 | 2615.754304 | 2416.816078 | 2324.006712 | 2568.534221 | 1790.074733 | 2156.944223 | ... | 699.020783 | 408.182918 | 13.719141 | 614.162325 | 242.881932 | 537.560430 | 640.396277 | 71.989106 | 15.671641 | 121.134253 |
| gene1 | 1736.262834 | 1102.800776 | 1202.438027 | 1846.884467 | 1004.449435 | 1161.452514 | 1267.909764 | 1432.889514 | 1176.173534 | 633.488180 | ... | 1426.345172 | 1447.027209 | 1606.243963 | 2253.905879 | 1643.103867 | 2278.306248 | 1456.288578 | 2015.417148 | 1947.948739 | 1425.494850 |
| gene2 | 2014.528625 | 2398.080280 | 1944.729892 | 2316.274409 | 2131.565037 | 2298.541242 | 2531.612209 | 2596.111747 | 2413.634703 | 2207.004282 | ... | 805.591423 | 937.059757 | 811.347534 | 819.525380 | 617.231009 | 660.709923 | 652.394533 | 823.183763 | 890.001682 | 982.703612 |
| gene3 | 659.427115 | 163.787569 | 561.642612 | 378.384480 | 519.343153 | 19.082749 | 847.503441 | 381.925232 | 707.469305 | 276.173993 | ... | 1487.512143 | 1086.595268 | 315.433694 | 1820.512500 | 1701.598813 | 1402.320642 | 1623.801592 | 1282.006193 | 1237.460095 | 862.684200 |
| gene4 | 557.430594 | 391.416889 | 842.972964 | 675.541378 | 850.962173 | 811.020469 | 986.334022 | 1345.391218 | 1264.336918 | 1136.040696 | ... | 492.540540 | 1170.198803 | 637.125151 | 83.639511 | 846.553239 | 718.903346 | 285.646841 | 68.010063 | 426.350989 | 523.634085 |
| ... | ... | ... | ... | ... | ... | ... | ... | ... | ... | ... | ... | ... | ... | ... | ... | ... | ... | ... | ... | ... | ... |
| gene995 | 1079.554741 | 1256.576785 | 371.790347 | 1552.897702 | 837.588520 | 781.422702 | 1410.911788 | 280.789440 | 1074.169879 | 891.334274 | ... | 914.248736 | 1039.659511 | 1424.090367 | 1528.602309 | 1048.966685 | 1217.551321 | 1595.634636 | 892.179251 | 733.385461 | 1326.974023 |
| gene996 | 1466.756618 | 682.381925 | 655.547941 | 1217.328283 | 1027.033929 | 743.552669 | 1303.702866 | 156.088532 | 1100.372258 | 1653.174072 | ... | 171.781193 | 409.069384 | 1064.053578 | 409.015074 | 1108.110725 | 522.949709 | 1141.158675 | 807.635314 | 650.720516 | 935.940121 |
| gene997 | 2667.592315 | 2705.673085 | 2692.679566 | 2451.598273 | 2265.107811 | 1688.030061 | 3214.672455 | 2487.450931 | 3213.472788 | 1963.800244 | ... | 2788.161130 | 2177.646822 | 1659.035894 | 1952.969200 | 2790.787782 | 2053.803419 | 2259.536840 | 2437.241921 | 1967.708017 | 2296.309486 |
| gene998 | 201.558856 | 400.279793 | 812.383524 | 262.929812 | 671.040851 | 580.943332 | 343.901157 | 476.913661 | 667.557218 | 168.932862 | ... | 621.693365 | 832.883736 | 1035.085086 | 512.018102 | 722.357924 | 507.593183 | 608.552576 | 169.301006 | 612.163599 | 186.982519 |
| gene999 | 1407.004628 | 1603.523673 | 1292.689612 | 1675.310108 | 1112.094279 | 907.000656 | 741.737107 | 720.647700 | 1740.447591 | 844.582854 | ... | 1109.305059 | 1289.918539 | 1080.680714 | 1104.604265 | 224.328929 | 1545.090453 | 1048.014265 | 1194.242678 | 2064.968748 | 1023.087880 |
1000 rows × 100 columns
data['df_pheno']
sample0     P0
sample1     P1
sample2     P1
sample3     P0
sample4     P0
            ..
sample95    P1
sample96    P1
sample97    P0
sample98    P1
sample99    P1
Length: 100, dtype: object
Clustering Results#
R.cluster_properties
{'error': 0.019708484590104557,
 'method': 'kmeans_a',
 'dist_type': 'a',
 'n_clusters': 8,
 'npass': 20,
 'score': 1201.8480840703078}
R.res
| P0 | P1 | matched | |
|---|---|---|---|
| gene0 | 6 | 1 | False |
| gene1 | 0 | 3 | False |
| gene2 | 6 | 2 | False |
| gene3 | 4 | 3 | False |
| gene4 | 2 | 4 | False |
| ... | ... | ... | ... |
| gene995 | 0 | 0 | True |
| gene996 | 7 | 7 | True |
| gene997 | 6 | 6 | True |
| gene998 | 5 | 2 | False |
| gene999 | 0 | 0 | True |
1000 rows × 3 columns
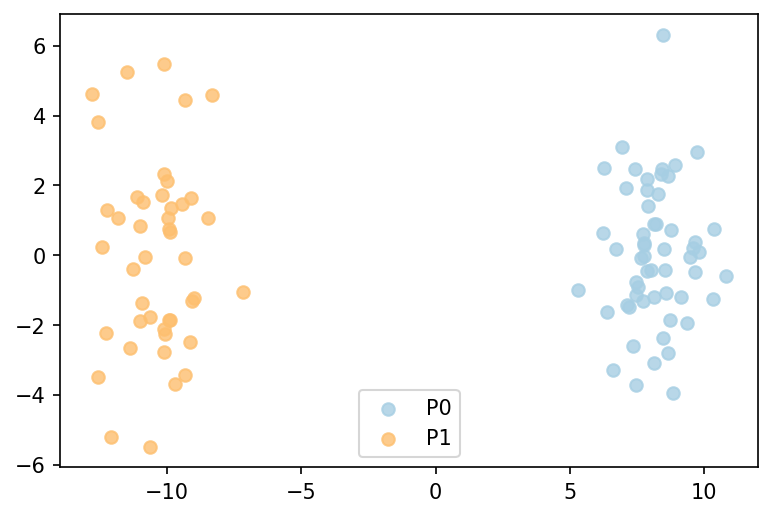
from MATTE.analysis import Fig_SampleFeature
sf = R.SampleFeature(corr=False)
f = Fig_SampleFeature(sf,R.pheno)
R.ModuleSNR(sf)[0:5]
M6.1_0    3.900981
M6.7_0    3.737174
M4.6_0    3.094177
M6.5_0    2.974524
M2.6_0    2.712792
dtype: float64
GeneRanker#
GeneRanker is a buildin class that select key genes or embed data by
module calculation.
In this step, multiple phenotypes can be received.
from MATTE import GeneRanker
ranker = GeneRanker(
    view='dist', # or cross-dist or module or gene
    pipeline=None)
gene_rank = ranker.gene_rank(X = data['df_exp'].T, y=data['df_pheno'],verbose=False)
gene_rank
gene0      49.673632
gene1      30.753564
gene2      52.062673
gene3      42.914437
gene4      29.995634
             ...
gene995    30.475068
gene996    29.614591
gene997    52.701640
gene998    34.376199
gene999    30.843078
Length: 1000, dtype: float64
Module Analysis#
from MATTE.analysis import Fig_SampleFeature
# Showing the Summary.
R.summary()
# two figures can be get by following:
if False:
f1 = R.Vis_Jmat() # genes' distribution
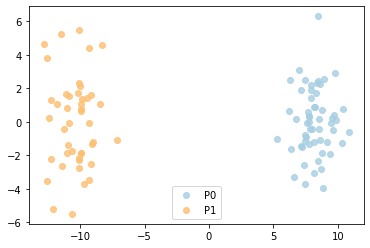
# Showing the samples' distribution
sf = R.SampleFeature()
f = Fig_SampleFeature(sf,labels=R.pheno,dpi=300,model=PCA())
# --- Number of genes:
Same Module Genes: 592
Different Module Genes: 408
# --- clustering score:
error 0.019385038222335626
method kmeans_a
dist_type a
n_clusters 8
npass 20
score 1347.1291565248384
# --- samples' distribution:

Function Analysis#
Read go annote files. File can be downloaded from https://ftp.ncbi.nih.gov/gene/DATA/
import pandas as pd
annote_file = pd.read_table("A:/Data/Annotation/gene2go")
annote_file = annote_file[annote_file["#tax_id"] == 9606]
def lst_change(lst,target,changed):
    ret = []
    for i in lst:
        if i == target:
            ret.append(changed)
        else:
            ret.append(i)
    return ret
## Change columns name.
annote_file.columns = lst_change(annote_file.columns,"GO_term","Term")
annote_file.columns = lst_change(annote_file.columns,"GO_ID","Term_ID")
## randomly select some genes
import numpy as np
from random import sample
unique_genes = np.unique(annote_file['GeneID'].values)
selected_genes = sample(unique_genes.tolist(),100)
The format of input files are following:
gene_set     iteral object, containing gene id.
annote_file  with columns ["Term_ID","GeneID","Term","Category"],and each row is an entry.
annote_file
| #tax_id | GeneID | Term_ID | Evidence | Qualifier | Term | PubMed | Category | |
|---|---|---|---|---|---|---|---|---|
| 640889 | 9606 | 1 | GO:0003674 | ND | enables | molecular_function | - | Function |
| 640890 | 9606 | 1 | GO:0005576 | HDA | located_in | extracellular region | 27068509 | Component |
| 640891 | 9606 | 1 | GO:0005576 | IDA | located_in | extracellular region | 3458201 | Component |
| 640892 | 9606 | 1 | GO:0005576 | TAS | located_in | extracellular region | - | Component |
| 640893 | 9606 | 1 | GO:0005615 | HDA | located_in | extracellular space | 16502470 | Component |
| ... | ... | ... | ... | ... | ... | ... | ... | ... |
| 971204 | 9606 | 118568804 | GO:0004930 | IEA | enables | G protein-coupled receptor activity | - | Function |
| 971205 | 9606 | 118568804 | GO:0004984 | IEA | enables | olfactory receptor activity | - | Function |
| 971206 | 9606 | 118568804 | GO:0007186 | IEA | involved_in | G protein-coupled receptor signaling pathway | - | Process |
| 971207 | 9606 | 118568804 | GO:0016021 | IEA | located_in | integral component of membrane | - | Component |
| 971208 | 9606 | 118568804 | GO:0050911 | IEA | involved_in | detection of chemical stimulus involved in sen... | - | Process |
330320 rows × 8 columns
from MATTE.analysis import FunctionEnrich
all_items,term_genes = FunctionEnrich(annote_file,selected_genes)
100%|██████████| 18684/18684 [02:06<00:00, 147.40it/s]
The function FunctionEnrich return two object:
all_item    Terms with p_value, fdr and other information
term_genes  each term enriches what genes
## Filtering the enriched results
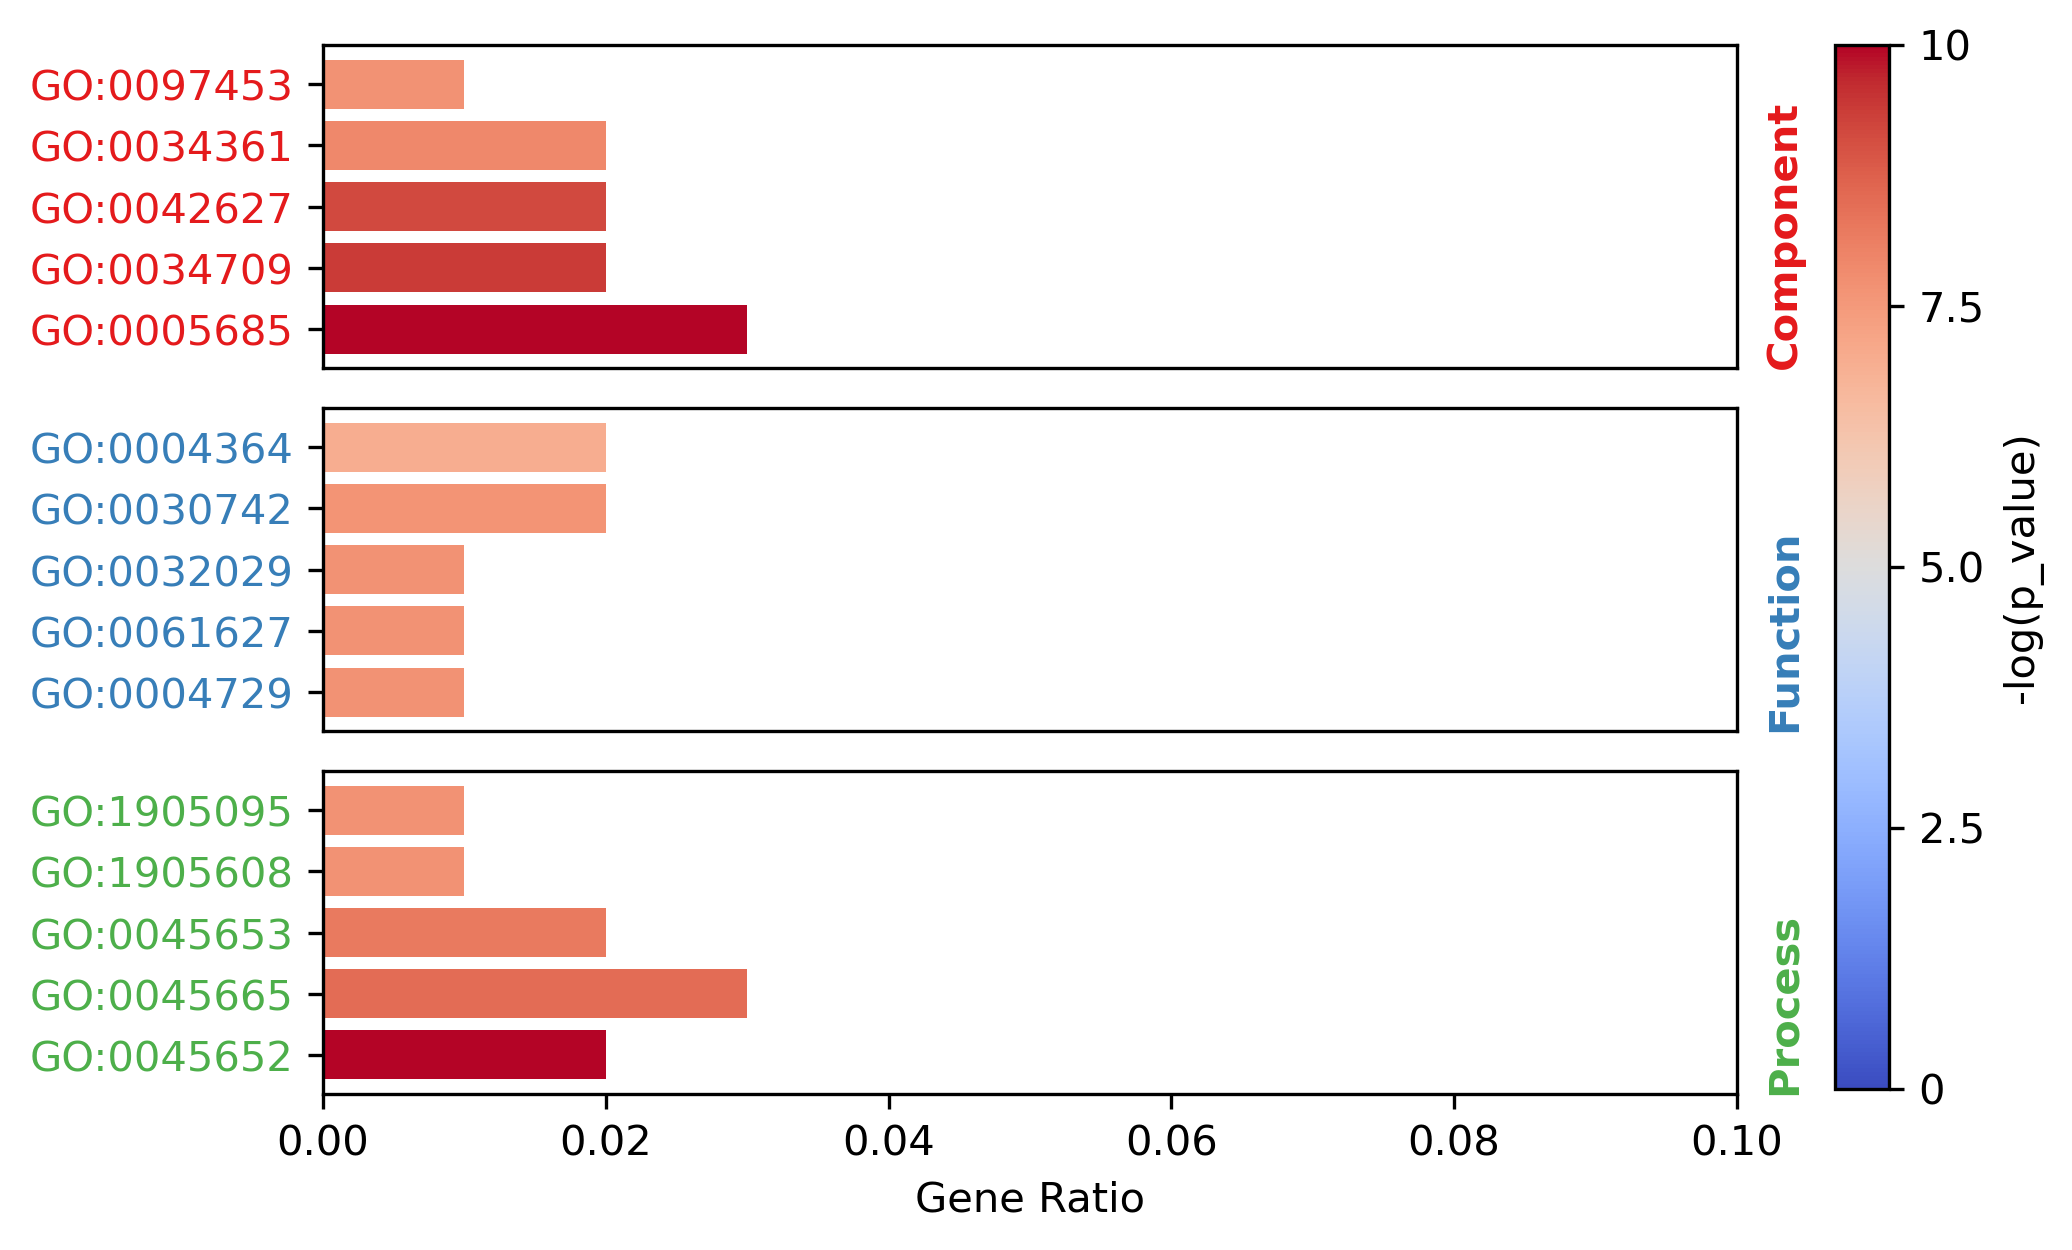
target = all_items.groupby(by="Category").apply(lambda x: x.sort_values(by="p_value").iloc[0:5,:])
target.index= [i[1] for i in target.index]
target
| Term | Category | n_enriched | n_backgroud | p_value | fdr | gene_ratio | |
|---|---|---|---|---|---|---|---|
| GO:0005685 | U1 snRNP | Component | 3 | 33 | 0.000538 | 0.94667 | 0.03 |
| GO:0034709 | methylosome | Component | 2 | 12 | 0.001479 | 1.0 | 0.02 |
| GO:0042627 | chylomicron | Component | 2 | 13 | 0.001743 | 1.0 | 0.02 |
| GO:0034361 | very-low-density lipoprotein particle | Component | 2 | 20 | 0.004153 | 1.0 | 0.02 |
| GO:0097453 | mesaxon | Component | 1 | 1 | 0.004834 | 1.0 | 0.01 |
| GO:0004729 | oxygen-dependent protoporphyrinogen oxidase ac... | Function | 1 | 1 | 0.004834 | 1.0 | 0.01 |
| GO:0061627 | S-methylmethionine-homocysteine S-methyltransf... | Function | 1 | 1 | 0.004834 | 1.0 | 0.01 |
| GO:0032029 | myosin tail binding | Function | 1 | 1 | 0.004834 | 1.0 | 0.01 |
| GO:0030742 | GTP-dependent protein binding | Function | 2 | 22 | 0.005018 | 1.0 | 0.02 |
| GO:0004364 | glutathione transferase activity | Function | 2 | 28 | 0.008057 | 1.0 | 0.02 |
| GO:0045652 | regulation of megakaryocyte differentiation | Process | 2 | 8 | 0.000636 | 1.0 | 0.02 |
| GO:0045665 | negative regulation of neuron differentiation | Process | 3 | 58 | 0.002789 | 1.0 | 0.03 |
| GO:0045653 | negative regulation of megakaryocyte different... | Process | 2 | 18 | 0.003365 | 1.0 | 0.02 |
| GO:1905608 | positive regulation of presynapse assembly | Process | 1 | 1 | 0.004834 | 1.0 | 0.01 |
| GO:1905095 | negative regulation of apolipoprotein A-I-medi... | Process | 1 | 1 | 0.004834 | 1.0 | 0.01 |
from MATTE.analysis import Fig_Fuction
f = Fig_Fuction(target,"p_value",dpi=300)